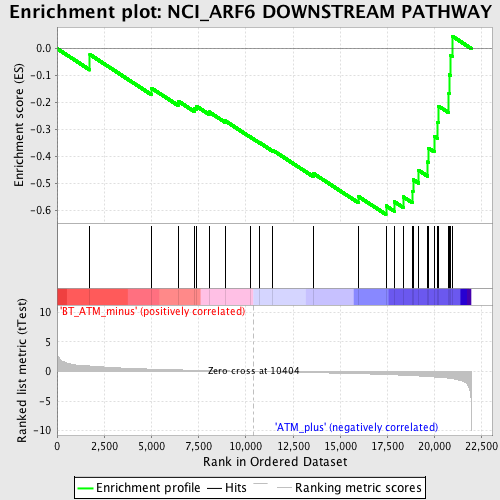
Profile of the Running ES Score & Positions of GeneSet Members on the Rank Ordered List
| Dataset | Set_02_BT_ATM_minus_versus_ATM_plus.phenotype_BT_ATM_minus_versus_ATM_plus.cls #BT_ATM_minus_versus_ATM_plus.phenotype_BT_ATM_minus_versus_ATM_plus.cls #BT_ATM_minus_versus_ATM_plus_repos |
| Phenotype | phenotype_BT_ATM_minus_versus_ATM_plus.cls#BT_ATM_minus_versus_ATM_plus_repos |
| Upregulated in class | ATM_plus |
| GeneSet | NCI_ARF6 DOWNSTREAM PATHWAY |
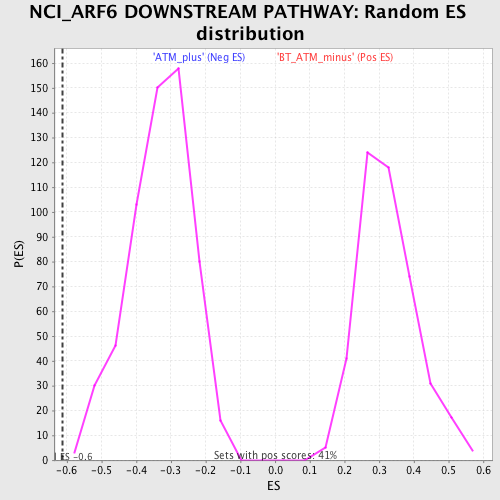
| Enrichment Score (ES) | -0.61397755 |
| Normalized Enrichment Score (NES) | -1.8530544 |
| Nominal p-value | 0.0 |
| FDR q-value | 0.27999339 |
| FWER p-Value | 0.498 |
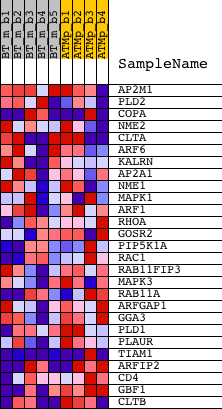
| PROBE | DESCRIPTION (from dataset) | GENE SYMBOL | GENE_TITLE | RANK IN GENE LIST | RANK METRIC SCORE | RUNNING ES | CORE ENRICHMENT | |
|---|---|---|---|---|---|---|---|---|
| 1 | AP2M1 | 1442227_at 1442429_at 1443338_at 1450894_a_at 1457122_at | 1737 | 0.916 | -0.0220 | No | ||
| 2 | PLD2 | 1417237_at 1457252_x_at | 4991 | 0.392 | -0.1460 | No | ||
| 3 | COPA | 1415706_at 1437274_at | 6410 | 0.268 | -0.1940 | No | ||
| 4 | NME2 | 1448808_a_at | 7268 | 0.204 | -0.2203 | No | ||
| 5 | CLTA | 1421062_s_at 1434540_a_at 1444328_at | 7389 | 0.196 | -0.2136 | No | ||
| 6 | ARF6 | 1418822_a_at 1418823_at 1418824_at | 8050 | 0.150 | -0.2343 | No | ||
| 7 | KALRN | 1429796_at 1436066_at 1442341_at 1442554_s_at 1445900_at 1448023_at 1457690_at 1457899_at 1459065_at | 8910 | 0.095 | -0.2676 | No | ||
| 8 | AP2A1 | 1460724_at | 10219 | 0.012 | -0.3266 | No | ||
| 9 | NME1 | 1424110_a_at 1435277_x_at | 10739 | -0.020 | -0.3490 | No | ||
| 10 | MAPK1 | 1419568_at 1426585_s_at 1442876_at 1453104_at | 11428 | -0.064 | -0.3765 | No | ||
| 11 | ARF1 | 1420920_a_at 1426390_a_at | 13568 | -0.198 | -0.4617 | No | ||
| 12 | RHOA | 1437628_s_at | 15960 | -0.374 | -0.5474 | No | ||
| 13 | GOSR2 | 1419371_s_at 1419372_at | 17419 | -0.514 | -0.5818 | Yes | ||
| 14 | PIP5K1A | 1421833_at 1421834_at 1450389_s_at | 17869 | -0.566 | -0.5670 | Yes | ||
| 15 | RAC1 | 1423734_at 1437674_at 1451086_s_at | 18330 | -0.627 | -0.5488 | Yes | ||
| 16 | RAB11FIP3 | 1438022_at 1457864_at | 18822 | -0.701 | -0.5274 | Yes | ||
| 17 | MAPK3 | 1427060_at | 18852 | -0.706 | -0.4846 | Yes | ||
| 18 | RAB11A | 1449256_a_at | 19146 | -0.755 | -0.4508 | Yes | ||
| 19 | ARFGAP1 | 1427245_at 1445067_at | 19622 | -0.846 | -0.4196 | Yes | ||
| 20 | GGA3 | 1438008_at | 19661 | -0.853 | -0.3680 | Yes | ||
| 21 | PLD1 | 1425739_at 1437112_at 1437113_s_at | 19967 | -0.925 | -0.3241 | Yes | ||
| 22 | PLAUR | 1452521_a_at | 20150 | -0.969 | -0.2718 | Yes | ||
| 23 | TIAM1 | 1418057_at 1444373_at 1453887_a_at | 20197 | -0.980 | -0.2126 | Yes | ||
| 24 | ARFIP2 | 1424240_at 1435498_at | 20747 | -1.131 | -0.1670 | Yes | ||
| 25 | CD4 | 1419696_at 1427779_a_at | 20765 | -1.140 | -0.0965 | Yes | ||
| 26 | GBF1 | 1415709_s_at 1415757_at 1432677_at 1438207_at | 20847 | -1.177 | -0.0266 | Yes | ||
| 27 | CLTB | 1453063_at 1456797_at 1460740_at | 20923 | -1.218 | 0.0461 | Yes |